
BJERKE / DSGN
Senior Design Lead · IBM
Challenge
The Problem
What we were solving
Traditional application monitoring tools forced developers through tedious manual configuration before they could see any data — taking time away from building applications. DevOps teams needed a way to get insight into application health and performance without setup overhead, and a way to correlate performance changes with the code deployments that caused them.
Design goal
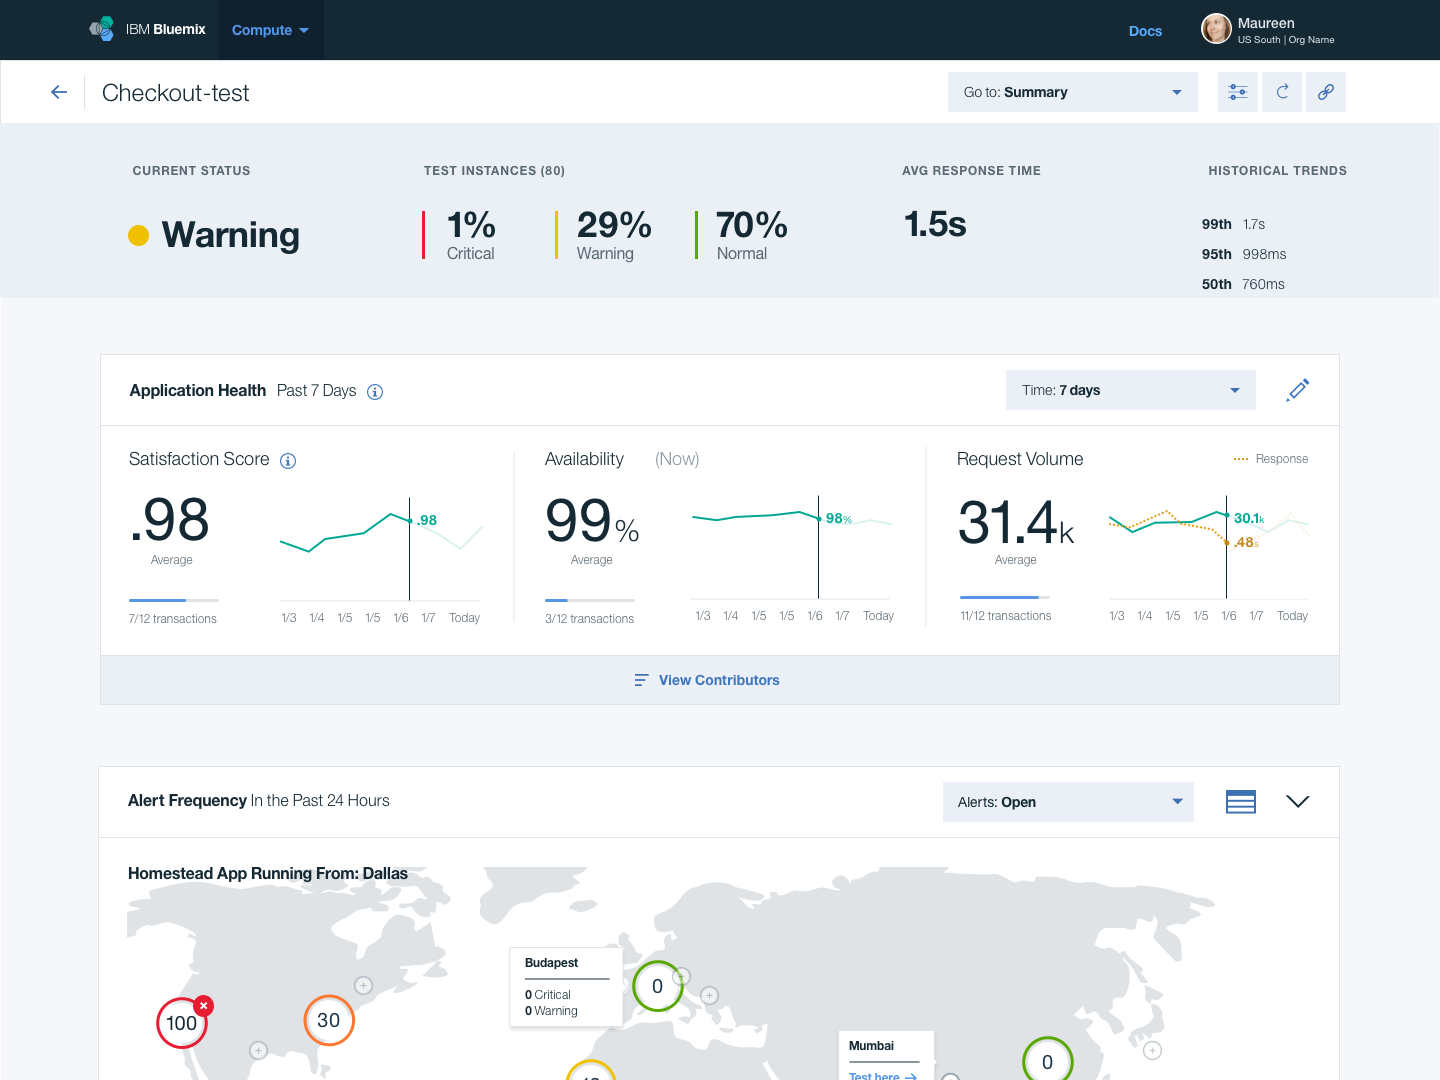
Design an application monitoring experience that gets developers to first data in under 5 minutes, provides immediate visibility into app health, and lets DevOps teams correlate performance changes with code deployments without manually cross-referencing spreadsheets.
Constraints
- ·
Must work within IBM Bluemix platform constraints
- ·
Target audience: DevOps teams and developers with varying monitoring experience
- ·
Integration with existing monitoring APIs and continuous deployment workflows
- ·
Launched November 2016 at IBM Studio in Austin, TX
How we learned
Research
Findings
Research with DevOps teams revealed setup complexity was the primary barrier to adoption — developers abandoned monitoring configuration when it required more than 5 steps before seeing any data. Correlating performance changes with deployments was the most-requested feature; teams were doing it manually in spreadsheets. The design addressed both: radical simplification of setup, and deployment correlation as a first-class feature.
Methods
- 1.
Developer interviews and workflow mapping
- 2.
Competitive analysis of monitoring tools
- 3.
Usability testing with DevOps teams
- 4.
5-step rule validation — testing where setup complexity caused abandonment
Developers abandoned monitoring setup when it required more than 5 configuration steps before seeing any data. The design target became: useful data in under 5 minutes.
— Developer Interviews
Correlating performance changes with code deployments was the most requested feature — DevOps teams were doing this manually in spreadsheets. Making it automatic became the product's signature capability.
— DevOps Workflow Mapping
How we worked
Process
Developer Research · 3 weeks
Mapped DevOps workflows and identified the key pain points in existing monitoring tool setup and usage. Established the 5-step rule as the primary design constraint.
Simplified Onboarding Design · 4 weeks
Designed a streamlined setup flow that got developers to first data in under 5 minutes. Applied progressive disclosure to surface complexity only when needed.
Dashboard & Deployment Correlation · 6 weeks
Designed the core monitoring dashboard with deployment correlation features — turning what teams were doing in spreadsheets into a first-class product capability.
Impact
Outcomes
Summary
The product launched in November 2016 at IBM Studio in Austin, TX and went on to win four international design awards — including the Golden A' Design Award (top 3% globally) and Outstanding Technical Achievement Award from IBM.
International Design Awards
Top-tier recognition
The Golden A' Design Award is a prestigious award given to top 3% percentile designs that has exhibited an exemplary level of quality in design.
A' Design Award & Competition